
CTFX Forex Help & Guides, CTFX Forex Tips & Tricks
How to Read a Forex Chart: The Complete Beginner’s Guide
May
Every candle, line, and squiggle on a forex chart tells you a story about price. Most guides jump straight into indicators and patterns before explaining what you’re actually looking at, which is exactly backwards for a beginner. At CTFX School of Trading, founded in 2017 by Ekraam Ebrahim in Cape Town, chart reading is the first skill every student learns before a single trade is placed — because you can’t manage risk on a chart you don’t understand. With well over 190,000 South Africans now trading forex online, and most of them stopping at a basic line chart, mastering the fuller picture is often worth more than learning a new strategy.
This guide starts at zero and builds up: what a chart actually shows you, the three chart types and why one became the industry standard, how to read a single candlestick, how to choose a timeframe, and how to spot the trend, support, and resistance levels that turn a chart from a picture into a decision.
What You’re Actually Looking at on a Forex Chart
A forex chart is a picture of price over time. That’s it. The vertical axis shows price — how much one currency costs in terms of another. The horizontal axis shows time, moving from left (older) to right (newer). Every chart you’ll ever look at is built on those two simple axes, and every wiggle on it is buyers and sellers disagreeing about value, with one side winning for a moment.
The “pair” you’re trading, like USD/ZAR, tells you what’s being measured: how many South African rand it takes to buy one US dollar. When the line moves up, the dollar is strengthening against the rand; when it moves down, the rand is gaining ground. For South African beginners, USD/ZAR is a natural starting point — watching how the rand reacts to local news events on a Daily chart makes candlestick patterns feel real and relevant fast. Price moves because more people want to buy than sell, or the reverse, and time tells you how long that battle has been going on: a chart that’s climbed steadily for three days tells a very different story than one that spiked in the last ten minutes.
The Three Forex Chart Types
Every forex platform gives you three ways to view the same price data:
- Line chart — connects closing prices with a single line. Clean and simple, and useful for the big picture, but it strips out most of the detail happening within each period.
- Bar chart (OHLC) — each vertical bar shows the open, high, low, and close of a time period, with small tick marks on the left (open) and right (close). More information than a line chart, but it takes practice to read at a glance.
- Candlestick chart — shows the same four data points as a bar chart, in a shape that’s far easier to scan quickly. This is the industry standard for a reason.
Beginners are usually best served starting with a line chart just to get comfortable with the idea of price moving over time, then moving to candlesticks as soon as pattern recognition becomes the goal — which, for anyone planning to actually trade, is almost immediately.
Why Candlestick Charts Are the Trader’s Default
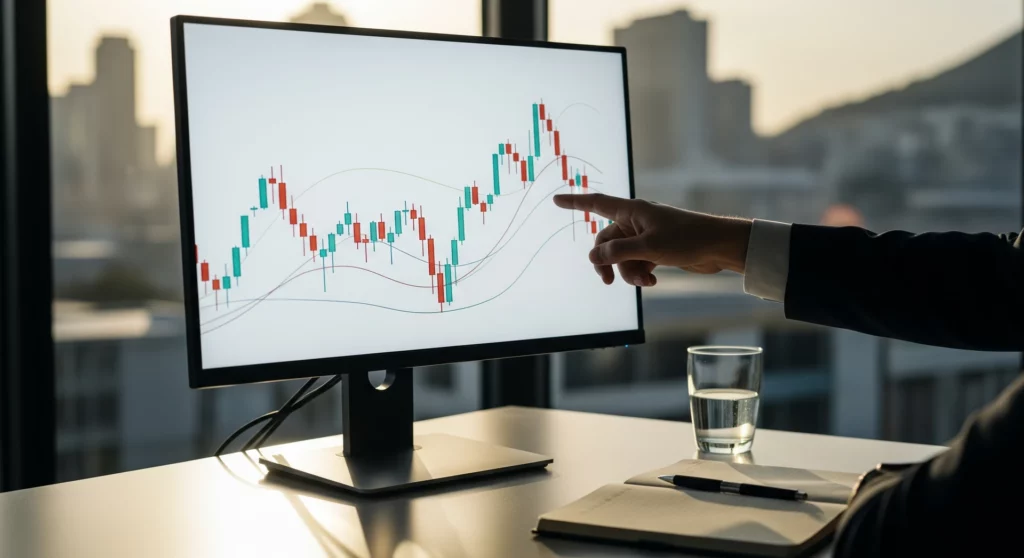
Candlestick charts originated in 18th-century Japan and have been the dominant chart style in professional trading for decades, not out of habit but because the format makes it genuinely faster to see what buyers and sellers are doing. Each candle has a body and wicks, and its colour tells you instantly whether price moved up or down in that period. Once you can read one candle, you can read any chart in the world.
How to Read a Candlestick: Body, Wicks, and What They Mean
Every candlestick contains four pieces of information about a specific time period: the open (where price started), the high (the highest point reached), the low (the lowest point reached), and the close (where price ended). Think of a candlestick as a scoreboard for a tug-of-war between buyers and sellers — the open and close tell you who won the round, and the high and low tell you how hard each side pushed during the fight.
Bullish vs. Bearish Candles
A bullish candle closes higher than it opened — buyers won that period. It typically appears green or white, with the close near the top of the body and the open near the bottom. A bearish candle closes lower than it opened — sellers took control — and typically appears red or black, with the open near the top and the close near the bottom. That’s genuinely all you need to start reading price direction at a glance.
What the Wicks (Shadows) Tell You
The thin lines extending above and below the body are wicks, or shadows, and they show where price tried to go but was rejected before the candle closed. A long upper wick means buyers pushed price up aggressively, but sellers fought back and closed it well off the high. A long lower wick means sellers drove price down hard, but buyers stepped in and pushed it back up before the close.
Three Candle Patterns Worth Knowing by Name
- Doji — the open and close are almost identical, leaving a very small body. Neither side won decisively, which signals indecision and often appears near turning points.
- Pin bar — a small body with one very long wick. A pin bar on the Daily chart near a known support level, for instance, shows sellers pushed price down hard but buyers rejected that move before the close — a classic reversal signal.
- Engulfing candle — one candle’s body completely covers the previous candle’s body in the opposite direction. A bearish engulfing after an uptrend, or a bullish engulfing after a downtrend, signals that momentum may be shifting.
Choosing the Right Timeframe for Your Trading Style
A timeframe is how much time each candle on your chart represents — a 1-minute chart prints a new candle every minute, a 4-hour chart every four hours, and so on. Forex is the largest financial market in the world by daily trading volume, operating 24 hours across global sessions, so the charts never stop printing new data. The timeframe you choose determines how much of that firehose you actually see at once, and it changes the story the chart appears to tell.
- M15 (15-minute) — suited to day traders who can watch screens for hours at a stretch.
- H1 (1-hour) — a middle ground that still needs regular attention during a session.
- H4 (4-hour) — good for traders who can check charts two or three times a day.
- Daily — one candle per trading day, ideal for swing traders who don’t want to be glued to a screen.
As Ekraam puts it, most beginner traders fail not because the market is too complex, but because they try to read five timeframes at once before they’ve learned to read one. Master the Daily chart first — everything else flows from there. Start on H4 or Daily: the lower timeframes are noisier, price jumps around more, false signals appear more often, and stress levels climb. Once you can consistently read structure and spot levels on a Daily chart, stepping down to H4 or H1 becomes far more manageable, and holding period should drive the choice — trades held for days or weeks call for the 4-hour or daily chart, while trading within a single day calls for shorter timeframes that demand faster decisions.
A Common Timeframe Mistake
Most retail beginners default to short timeframes like the 1-minute or 5-minute chart because they feel more “active” — it seems like more is happening, so it feels like more opportunity. In practice this usually increases noise and emotional decision-making rather than clarity, since price whips around on short timeframes for reasons that have nothing to do with the bigger trend. The simpler fix is to start on a higher timeframe until a trend can be read confidently, then work down to shorter timeframes only once the bigger picture is already understood.
Spotting Support and Resistance Levels
Support and resistance are the backbone of chart reading — think of them as price memory, zones where the market has reversed or stalled before and where traders expect it to react again. Support is a price level below the current price where buyers have historically stepped in, stopping a fall; resistance is a level above the current price where sellers have historically taken control, capping a rise.
To draw one, look left on the chart and find places where price bounced up from the same zone multiple times, or reversed down from the same area more than once, then draw a horizontal line through those zones. You’re not looking for a perfect price to the pip — you’re marking a zone where the market has shown memory. Start with horizontal levels before anything diagonal, and note that a clean horizontal level at a round number (like 18.00 on USD/ZAR, or 1.0800 on EUR/USD) tends to carry extra weight, because many traders are watching the same number.
These levels matter for entries and exits because they give you a logical map for decisions. If price is approaching strong resistance, that’s not the moment to buy in aggressively — it’s the moment to watch what the candles do when they get there. A pin bar or a doji forming right at that level is where high-probability setups develop. The same levels also help define risk: placing a stop-loss just beyond support or resistance makes logical sense, because if price breaks through convincingly, the level has failed and the reason for the trade is gone.
Drawing Trend Lines and Reading Market Direction
Before looking at any indicator, read the direction of the market: is it going up, going down, or moving sideways? An uptrend is a series of higher highs and higher lows — each peak clears the last one, and each pullback stops at a higher level than the previous dip; connecting the lows with a straight line gives you an uptrend line, the floor buyers are defending. A downtrend mirrors this: lower highs and lower lows, with each rally fizzling at a lower peak than the one before; connecting the highs draws a downtrend line, the ceiling sellers keep holding. A ranging market moves sideways between two roughly horizontal levels with no clear sequence of higher or lower points — many beginners try to force a trend onto a ranging chart, but if the highs and lows aren’t clearly progressing in one direction, the market is ranging, and that calls for a different approach entirely.
Trend lines aren’t magic; they’re a tool to visualise the path of least resistance. A market in an uptrend is, on balance, easier to buy; a market in a downtrend is generally easier to sell. Trading with the trend doesn’t guarantee winners, but it keeps the probability tilted in your favour.
A Note on Volume — and Why Forex Traders Lean on Price Action Instead
Volume matters a great deal in stock markets, where it confirms whether a price move has real participation behind it or is just thin-market noise. In forex, true volume data doesn’t exist the same way, because the market is decentralised — trades happen across a vast global network of banks, brokers, and institutions simultaneously, and no single exchange captures every transaction. The volume numbers shown on a forex platform are typically tick volume — how many times the price changed in a period — rather than actual traded amounts.
That doesn’t make forex unreadable. It means price action itself — the patterns, levels, and candle signals covered in this guide — is the primary tool. A strong rejection at resistance, a decisive engulfing candle, a break of a trend line with follow-through: these are the signals that matter, and none of them require a volume figure to read correctly. Indicators like RSI or MACD can still add value once the chart itself is understood — RSI flags potential overbought or oversold conditions, and MACD shows the relationship between two moving averages — but they work best layered on top of a chart you can already read, not as a substitute for reading it.
A Simple Checklist Before Your First Trade
Before opening any chart with real money on the line, run through this short list:
- Confirm you’re looking at a candlestick chart, not just a line chart.
- Check the timeframe and make sure it matches how long you plan to hold the trade.
- Identify the general trend — higher highs and higher lows, or the opposite.
- Mark any obvious support or resistance levels nearby.
- Watch how candles behave as price nears those levels before deciding anything.
Go through this checklist a few dozen times on historical charts before risking a single rand. That’s how genuine pattern recognition gets built — the kind no single article can teach on its own, but that becomes second nature with repetition.
If this breakdown has made forex charts feel more approachable, you’re ready for the next step. Reading a chart in isolation is one thing; knowing how to act on what you see is where structured guidance makes the difference. CTFX School of Trading offers beginner forex courses and one-on-one coaching with Ekraam Ebrahim, designed to take you from chart basics to confident, consistent trading. Book a coaching session or join a structured course to turn this framework into a habit you actually trade with.
