
CTFX Forex Help & Guides, CTFX Forex Tips & Tricks
Forex Chart Types Explained for South Africa

Jul
Forex trading in South Africa and Botswana is getting more popular every year. Over 190,000 South Africans are now actively trading forex online, making chart skills more relevant than ever. But most people stick to line charts and miss out on all the detailed clues hidden in candlesticks and bars. Here’s the catch: mastering just one extra chart type could make a bigger difference to your trades than learning a new strategy.
Table of Contents
- Understanding The Main Forex Chart Types
- How To Read Line, Bar, And Candlestick Charts
- Choosing The Right Chart Type For Local Traders
- Tips For Analysing Forex Charts In 2025
Quick Summary
| Takeaway | Explanation |
|---|---|
| Understanding Chart Types is Essential | Familiarity with line, candlestick, and bar charts is crucial for analyzing forex market movements and developing effective trading strategies. |
| Choose Chart Type Based on Experience | New traders should use line charts for simplicity, while experienced traders might prefer candlestick and bar charts for detailed insights. |
| Integrate Technical and Economic Indicators | Successful analysis requires understanding both technical indicators like RSI and MACD, and economic indicators that affect currency performance. |
| Continuous Learning is Key | Regular practice and adapting to new charting techniques can significantly enhance trading effectiveness in a constantly evolving market. |
Understanding the Main Forex Chart Types
Forex traders rely on chart types as critical visual tools for analyzing market movements and making strategic trading decisions. Understanding these chart representations allows traders to interpret price action, identify trends, and develop robust trading strategies.
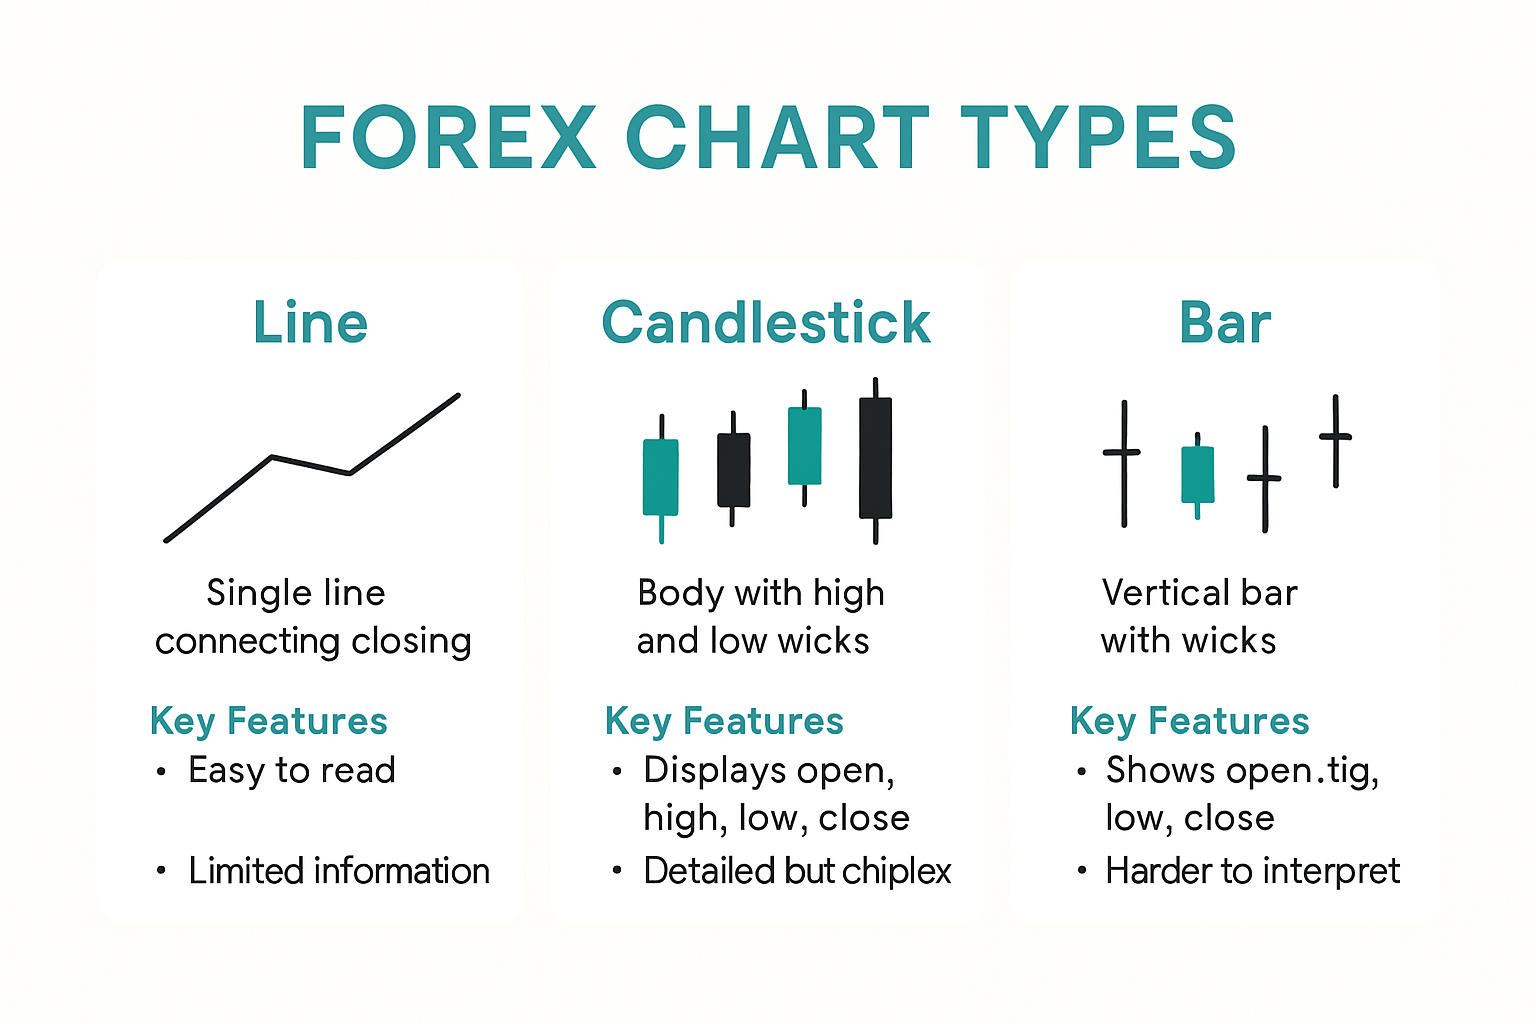
Line Charts: The Fundamental Visualization
Line charts represent the simplest form of forex chart types, connecting closing prices with a continuous line. Traders use these charts to get a quick overview of price movement over time. The line chart focuses exclusively on closing prices, which means it strips away the complex details of price fluctuations within each trading period.
In the context of south african forex trading, line charts provide a clean, straightforward way to track currency pair performance. Traders can quickly observe overall price trends without getting overwhelmed by minute price variations. Learn more about trading fundamentals for a comprehensive understanding of how these charts translate into practical trading strategies.
Candlestick Charts: Detailed Price Action Insights
Candlestick charts offer a more comprehensive view of price movements compared to line charts. Each candlestick represents a specific trading period and displays four key price points: opening price, closing price, highest price, and lowest price. The candlestick body shows the difference between opening and closing prices, while the wicks (or shadows) indicate the price range during that period.
Traders in South Africa and Botswana find candlestick charts particularly useful because they provide rich visual information about market sentiment. A green or white candlestick typically indicates a price increase, while a red or black candlestick suggests a price decrease. This color-coded system allows traders to quickly interpret market dynamics and potential trend reversals.
Bar Charts: Comprehensive Price Information
Bar charts represent another crucial forex chart type, similar to candlestick charts but with a different visual representation. Each bar shows the opening, closing, high, and low prices for a specific period. The vertical line represents the price range, with a small horizontal line on the left indicating the opening price and a similar line on the right showing the closing price.
For forex traders in the region, bar charts provide a clear, systematic way to analyze price movements. They offer more detailed information than line charts while maintaining a less visually complex appearance compared to candlestick charts. Traders can use bar charts to identify price trends, support and resistance levels, and potential trading opportunities.
Understanding these forex chart types is fundamental for developing effective trading strategies. Each chart type offers unique insights, and experienced traders often use multiple chart types to gain a comprehensive view of market movements. By mastering these visualization techniques, traders can make more informed decisions and improve their overall trading performance.
Remember that while chart types are essential tools, they represent just one aspect of successful forex trading. Continuous learning, risk management, and staying updated with global economic trends are equally crucial for long-term trading success.
How to Read Line, Bar, and Candlestick Charts
Mastering chart reading skills is crucial for forex traders seeking to make informed trading decisions. Each chart type provides unique insights into price movements, requiring specific interpretation techniques to extract valuable market information.
Decoding Line Charts: Simplicity in Price Tracking
Line charts represent the most straightforward method of tracking price movements. Traders focus on the continuous line connecting closing prices across different time periods. As noted by AvaTrade, these charts excel at revealing long-term price trends while eliminating the noise of intraday fluctuations.
To read a line chart effectively, traders should:
- Observe the overall direction of the line (upward, downward, or sideways)
- Identify key support and resistance levels
- Look for significant trend changes
Explore advanced trading techniques to enhance your line chart analysis skills and develop more robust trading strategies.
Bar Charts: Unveiling Comprehensive Price Dynamics

Bar charts provide a more detailed view of price movements, displaying four critical price points: open, high, low, and close prices. According to FXCM, these charts are instrumental in assessing market volatility and price direction.
Reading bar charts requires understanding their unique components:
- The vertical line represents the total price range for the period
- The left horizontal tick indicates the opening price
- The right horizontal tick shows the closing price
- Longer vertical lines suggest higher market volatility
- Shorter lines indicate more stable price movements
Traders in South Africa and Botswana can use bar charts to gain deeper insights into market behavior, identifying potential trading opportunities by analyzing price ranges and momentum.
Candlestick Charts: Advanced Market Sentiment Analysis
Candlestick charts offer the most sophisticated view of price movements, originating from 18th-century Japanese trading practices. As explained by Investopedia, these charts provide rich visual information about market sentiment and potential price reversals.
Key elements of candlestick chart reading include:
- Green or white candles indicate price increases (bullish)
- Red or black candles show price decreases (bearish)
- The candle body represents the price range between opening and closing
- Wicks or shadows display the highest and lowest prices during the period
Advanced traders look for specific candlestick patterns that signal potential market movements, such as:
- Hammer patterns suggesting potential trend reversals
- Doji patterns indicating market indecision
- Engulfing patterns signaling potential trend changes
Mastering these chart types requires practice, patience, and continuous learning. While each chart type offers unique insights, successful traders often combine multiple chart types to develop a comprehensive market analysis strategy. Remember that chart reading is just one aspect of forex trading – risk management, market knowledge, and emotional discipline are equally crucial for long-term trading success.
Below is a table comparing the three main forex chart types discussed above. This helps you quickly understand their features, benefits, and best use cases.
| Chart Type | Key Features | Information Displayed | Ideal For |
|---|---|---|---|
| Line Chart | Continuous line of closing prices, simple and uncluttered | Closing prices only | Beginners, spotting overall trends |
| Candlestick Chart | Colour-coded candles; shows open, close, high, low; visual patterns | Open, close, high, low prices | Advanced traders, sentiment analysis, pattern spotting |
| Bar Chart | Vertical bars; opening & closing ticks; detailed but less visual | Open, close, high, low prices | Intermediate/Advanced, volatility & range analysis |
Choosing the Right Chart Type for Local Traders
Selecting the appropriate chart type is a critical decision for forex traders in South Africa and Botswana. Each chart type offers unique advantages, and understanding their strengths helps traders make more informed investment decisions.
Experience Level and Chart Complexity
Traders must consider their skill level when choosing a chart type. According to Vantage Markets, different chart types suit varying levels of trading expertise. Beginners often benefit from simpler visualizations, while experienced traders can leverage more complex chart representations.
For novice traders, line charts provide an excellent starting point. Learn more about trading fundamentals to understand how chart selection impacts trading strategy. These charts offer a clean, straightforward view of price movements, allowing new traders to focus on basic trend identification without becoming overwhelmed by intricate details.
Trading Strategy and Market Analysis
Each chart type aligns differently with specific trading strategies. Candlestick charts excel for traders focusing on short-term price movements and market sentiment. As noted by Vantage Markets, these charts are particularly favored by South African traders for their ability to display open, close, high, and low prices in a visually intuitive manner.
Bar charts provide comprehensive market insights, showcasing trading ranges and volatility. Traders seeking detailed price information find these charts invaluable. The vertical lines representing price ranges help identify potential market trends and trading opportunities.
Technical Analysis and Decision Making
Advanced traders often combine multiple chart types to develop a robust analysis strategy. Line charts offer long-term trend visibility, while candlestick and bar charts provide granular market insights. This multi-chart approach allows traders to cross-reference information and make more confident trading decisions.
Consider these factors when selecting a chart type:
- Trading experience level
- Preferred trading timeframe
- Complexity of market analysis required
- Personal visual comprehension
Local traders in South Africa and Botswana should remember that chart selection is not a one-size-fits-all approach. Continuous learning, practice, and adaptability are key to mastering chart interpretation. Experiment with different chart types, understand their nuances, and develop a personalized trading strategy that leverages their unique strengths.
Ultimately, the most effective chart type is one that aligns with your trading goals, risk tolerance, and ability to interpret market signals accurately. Regular practice and a willingness to learn will help traders become proficient in reading and utilizing various forex chart types.
The table below organises how experience level and trading needs influence the best chart type choice for South African and Botswana traders.
| Experience Level | Recommended Chart Type | Primary Benefits |
|---|---|---|
| Beginner | Line Chart | Simplicity, easy trend identification |
| Intermediate | Bar Chart | More price details, volatility analysis |
| Advanced | Candlestick Chart | Sentiment analysis, pattern recognition |
| All Levels (Combo) | Multi-Chart Approach | Comprehensive analysis, cross-confirmation |
Tips for Analysing Forex Charts in 2025
Forex chart analysis continues to evolve, requiring traders in South Africa and Botswana to adapt their strategies and leverage advanced techniques to remain competitive in the dynamic 2025 trading landscape.
Understanding Technical Indicators for Precise Analysis
Technical indicators play a crucial role in interpreting forex charts effectively. According to Assegai FX, two key indicators traders should master are the Relative Strength Index (RSI) and Moving Average Convergence Divergence (MACD).
The Relative Strength Index (RSI) provides critical momentum insights. Traders can identify potential overbought or oversold conditions when the RSI moves above 70 or below 30. This helps in making more informed trading decisions by understanding market sentiment and potential price reversals.
The MACD indicator offers deeper trend analysis by showing the relationship between two moving averages. By examining the MACD line, signal line, and histogram, traders can detect potential buy and sell signals through crossover points and divergence patterns.
Explore advanced trading techniques to enhance your understanding of these technical indicators and improve your chart analysis skills.
Economic Indicators and Contextual Market Analysis
Successful forex chart analysis in 2025 extends beyond technical indicators. Traders must integrate comprehensive economic context into their strategies. As reported by ITWeb, monitoring key economic indicators becomes paramount for accurate market predictions.
Critical economic factors to track include:
- GDP growth rates
- Inflation trends
- Interest rate decisions
- Global economic stability
- Commodity price fluctuations
These indicators provide essential context for interpreting chart patterns, especially for currencies like the South African Rand (ZAR) that are sensitive to global economic shifts.
Advanced Chart Analysis Strategies
Modern forex chart analysis requires a multifaceted approach. Traders should develop skills in:
- Multi-timeframe analysis
- Pattern recognition
- Risk management integration
- Sentiment analysis
- Probabilistic thinking
Combining multiple chart types and indicators allows traders to create a more robust analysis framework. Line charts can reveal long-term trends, while candlestick and bar charts offer granular insights into short-term price movements.
Remember that chart analysis is not about perfect prediction but managing probabilities. Successful traders understand that no single indicator or chart type guarantees success. Continuous learning, adaptability, and disciplined risk management remain the cornerstone of effective forex trading.
As the forex market continues to evolve in 2025, traders in South Africa and Botswana must remain flexible, technologically aware, and committed to ongoing education. By mastering advanced chart analysis techniques and maintaining a holistic view of market dynamics, traders can position themselves for potential success in an increasingly complex global trading environment.
Frequently Asked Questions
What are the main types of forex charts used in trading?
The main types of forex charts used in trading are line charts, candlestick charts, and bar charts. Each type provides different insights into price movements and trends.
How do I read a candlestick chart in forex trading?
To read a candlestick chart, focus on the body and wicks of the candles. The body shows the opening and closing prices, while the wicks indicate the highest and lowest prices during the trading period. Green candles indicate price increases, while red candles indicate price decreases.
Which forex chart is best for beginners in South Africa?
For beginners in South Africa, line charts are often the best choice. They provide a simple and clear representation of price movements over time, making it easier to identify overall trends without complex details.
How can I improve my forex chart analysis skills in 2025?
To improve forex chart analysis skills in 2025, traders should focus on mastering technical indicators, understanding economic indicators, and practicing multi-timeframe analysis. Continuous learning through advanced techniques can enhance overall trading effectiveness.
Ready to Master the Forex Charts That Define Your Success?
Are you struggling to move past simple line charts and confused by the technical side of candlestick or bar charts? The article above showed how most South African and Botswana traders miss out on key market signals just by not knowing how to unlock deeper chart analysis. If you want to spot market trends with confidence and avoid feeling lost when looking at detailed chart patterns, you need more than just information. You need structured guidance and practical mentorship that speaks to your journey.

Take charge of your trading journey today. The CTFX School of Trading based in Cape Town gives you everything from beginner basics and line chart reading right up to advanced multi-chart strategies using real market examples from our region. Whether you are brand new or looking to finally understand candlesticks and indicators, you can get hands-on skills and ongoing coaching shaped for South African needs. Explore our unique approach now and see how easy it is to turn knowledge into real results. Your next step towards confident, profitable chart analysis starts here. Act now and secure your place as a well-equipped trader in 2025.
Recommended
- Best Forex Trading Course & Coaching: Cape Town South Africa
- Exclusive Private Forex Course – 1-on-1 Trading Training
- Expert-Led Group Forex Course – Learn & Trade Together
- Expert-Led Group Forex Course – Learn & Trade Together
- Free Intro – SA’s Best Forex Trading Course & Coaching Classes